
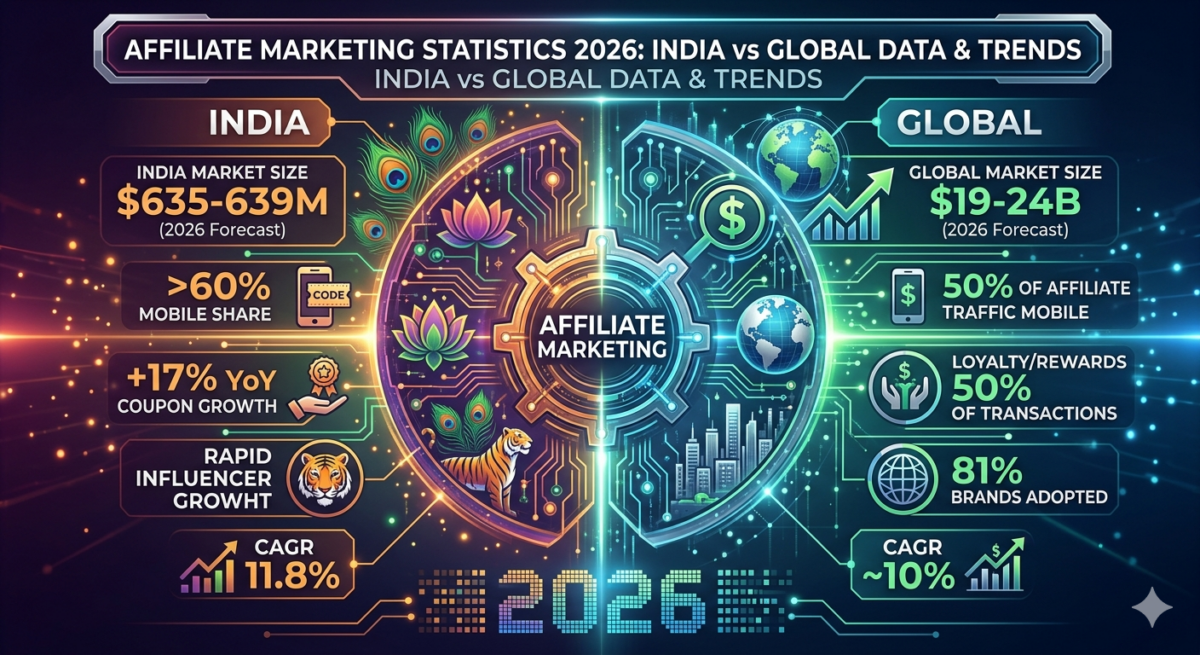
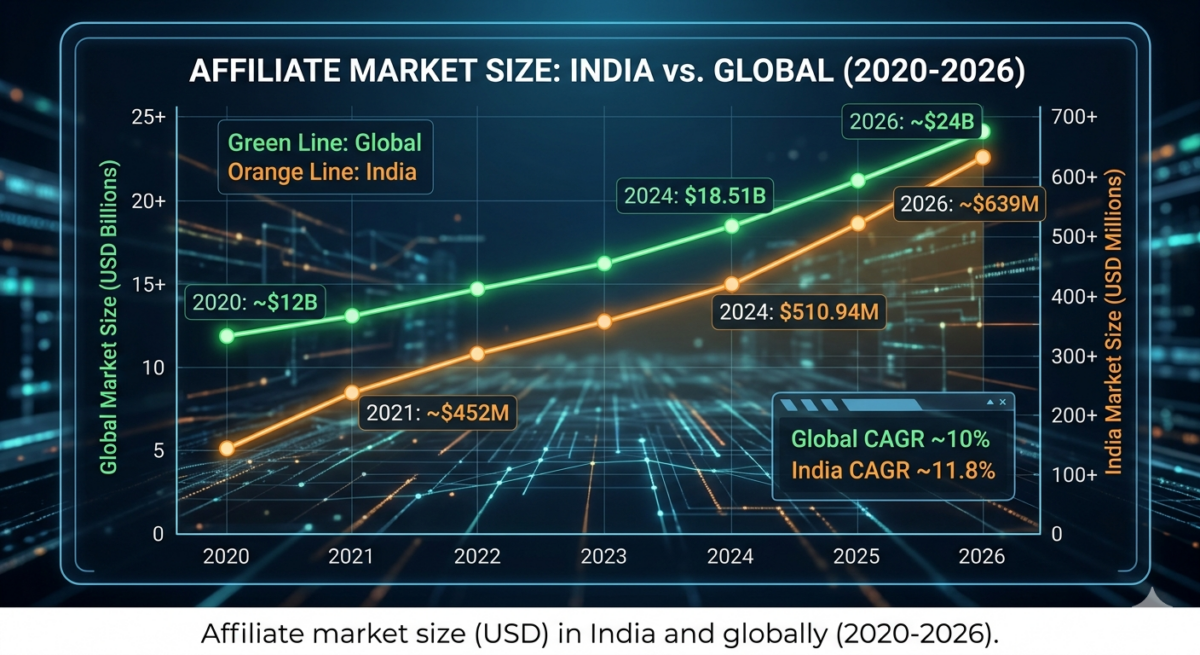
Affiliate marketing is a rapidly expanding channel both worldwide and in India. Globally, the affiliate market is billions of dollars in size, roughly $18.5 billion in 2024 (source: Cognitive Market Research), and projected to grow to $19-24 billion by 2025-2026.
India’s affiliate market is a smaller subset but growing faster: it was $510.94 million in 2024 and is forecast to reach about $635-638 million by 2026 (CAGR 11.8%). This growth mirrors India’s booming e‑commerce: In 2020 there were 242 million Indian online shoppers, and India’s e-tail GMV hit INR 4,416.68 billion ($53B) in 2024.
Key metrics to watch include conversion rates (~1-3% on average globally, higher in top verticals like retail/fashion around 4-5%), average order value (affiliates often drive higher AOV than non-affiliate traffic), and channel breakdown (loyalty/rewards affiliates alone account for 33% of spend but 50% of transactions globally).
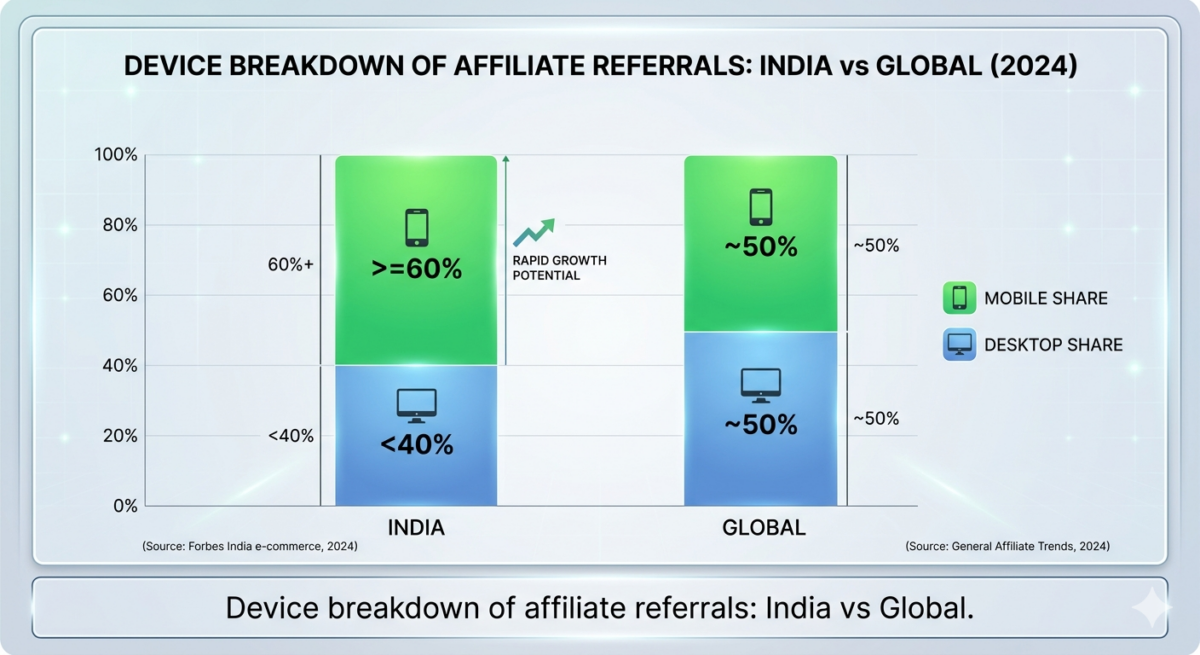
Importantly, coupon and cashback platforms are critical drivers: globally they handle 27% of all affiliate‐referred sales, and in India coupon-driven orders jumped 17% in 2024. Mobile is dominant: smartphones account for >60% of India’s e-commerce purchases and about half of affiliate traffic worldwide.
Tables 1-2 below compare India vs global figures, and Figure 1 (ahead in the article) shows major industry milestones. Overall, most brands (~81%) now run affiliate programs, and affiliates view it as a top channel: 79% of affiliates use SEO and 42% of influencers monetize with affiliate links.
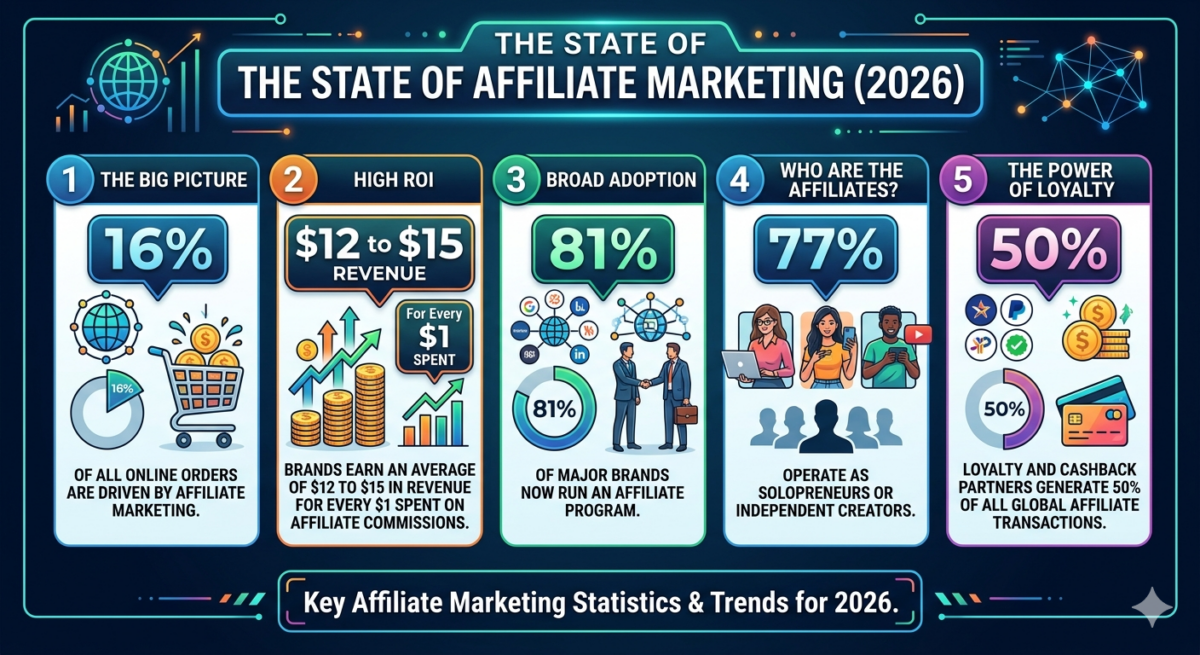
In sum, affiliate marketing’s importance is surging: with high ROI (often ~$12 revenue per $1 spent) and broad adoption, this article collates 30+ verified stats to guide publishers and advertisers in 2026.
| Metric | India | Global | Year |
| Affiliate Market Size | $510.94M | $18.5B | 2024 |
| Market CAGR (forecast) | ~11.8% | ~10% | (2026 Forecast) |
| E-commerce users | 242M | ~4.54B | 2020 (Covid-19 boom) |
| Mobile share of e-comm. sales | >60% (smartphones) | ~50% of affiliate transactions | 2024 |
| Loyalty/Cashback Affiliate (%) | High usage (cashback sites prevalent) | 33% of affiliate spend; 50% of sales | 2025 |
| Coupon Site Growth | +17% YoY orders | 6% of affiliate spend; 9% of sales | 2024-2025 |
| Content Affiliates (%) | Many blogs/content creators | 44% of affiliate spend; 27% of sales | 2025 |
| Influencer Partners (%) | Rapidly growing in India | 4% of affiliate spend; 6% of sales | 2025 |
| Conversion Rate (overall) | N/A | 1-3% average; 4.2% in retail | 2026 |
| Affiliate Adoption (brands) | Major e-tailers & SaaS | 81% of brands, 84% of publishers | 2026 |
| Avg. Commission ROI | High (20x-30x typical) | ≈$12 revenue per $1 spend | 2025 |
Table 1: Comparison of key affiliate marketing metrics, India vs Global (latest data).
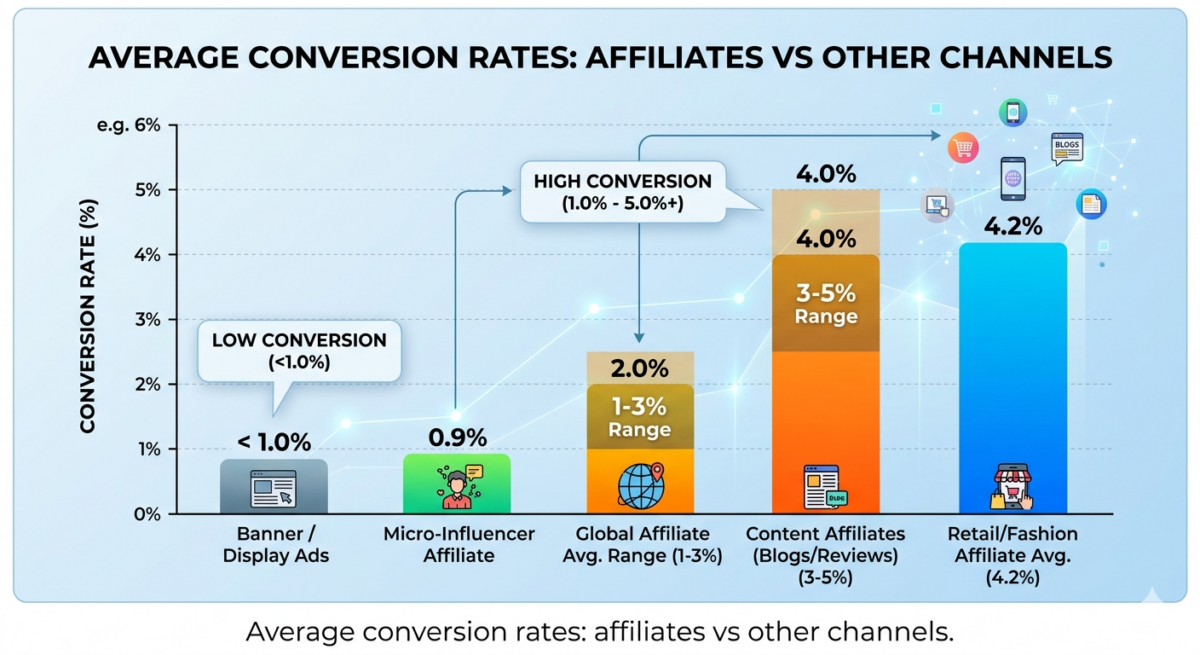
Table of Contents
India Affiliate Marketing Statistics
Market Size & Growth (2021-2026)
India’s affiliate market is rapidly expanding. In 2024 it was roughly $510.94 million. Projecting the 11.8% CAGR, yields about $571M in 2025 and $638M in 2026. By contrast, the Asia-Pacific affiliate market was $4.26B in 2024.
India’s growth is fueled by e-commerce: 242 million Indians shopped online in 2020, and online retail reached INR 4.416T in 2024. With affordable data and smartphones, India sees >60% of e‑commerce on mobile devices.
From 2021 to 2024, India’s affiliate revenue grew from ~$452M to ~$511M. Continued double-digit growth through 2028 is forecasted, potentially doubling the market by 2030.
Channels & Conversions
Coupon and cashback partners are central in India. Indian coupon-based orders jumped 20% in 2023 and 17% in H1 2024. Indian shoppers used coupons 7% more often in 2024. These deals drive larger baskets: a purchase with a coupon averaged $36.6 in India (vs $55.8 globally).
Indian coupon affiliate revenues grew 15%+ in 2024. Globally, coupons account for ~27% of affiliate sales; in India they are higher. Content publishers (blogs, review sites) are also big players: while global data split content affiliates (44% of spend, 27% of sales), India has hundreds of blogs and media sites monetizing via affiliate links.
Influencer partnerships are emerging as brand-affiliate partnerships grew +93% YoY in 2024, reflecting influencers’ rising role (in India, many YouTubers and Instagrammers now run affiliate promos).
Top Verticals
Indian affiliates cover all e-commerce segments. Confirmed top categories from coupon usage include Electronics (21%), Apparel (18.8%), and Home & Garden (11.1%). Travel and fin-tech also have large affiliate programs.
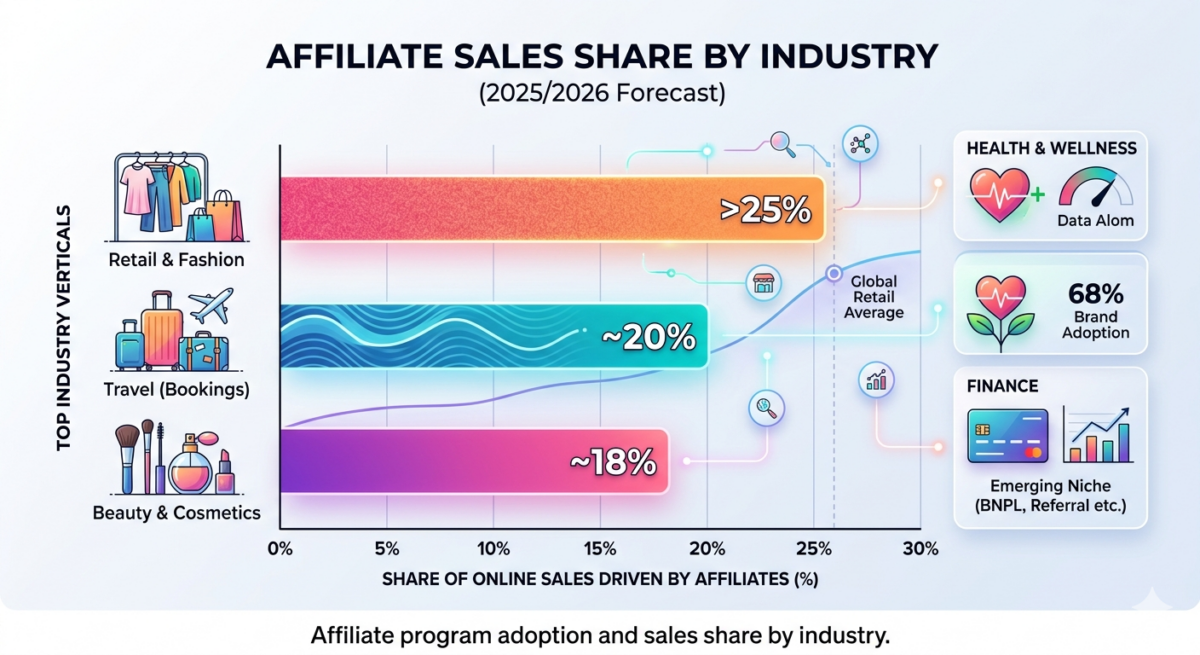
Globally, retail/fashion is king (often driving >25% of sales via affiliates), and travel affiliates handle ~20% of bookings. In India, affiliate marketing is growing in newer verticals too (e.g. online education platforms now offer heavy affiliate commission to capture Gen Z; food delivery affiliates etc.).
~68% of health/wellness brands run affiliates, and affiliates drive ~18% of sales in beauty/cosmetics, trends that mirror emerging niches in India.
Mobile & Device Trends
India’s affiliates are mobile-first. Over 880M Indians had the internet by 2023, mostly via smartphones. Forbes reports 60% of India’s e-comm transactions are on mobile.
Globally, mobile accounts for ~55% of affiliate clicks and ~50% of affiliate sales. Besides, there is a similar or higher mobile share in India. Given rising smartphone penetration, Indian affiliate programs must optimize for mobile (apps, deep links, in-app offers).
Publisher & Influencer Stats (earnings)
Most Indian affiliates are individual bloggers/influencers. Globally, 77% of affiliates are solopreneurs and ~58% earn <$10K/year. We expect Indian affiliates to be similar (many do affiliate on the side).
On the plus side, Indian coupon blogs and YouTube reviewers can reach large audiences. Interestingly, global surveys show 71% Influencers saying that affiliate commissions are their fastest-growing revenue, a trend visible in India’s influencer marketing boom.
Conversion-wise, micro-influencers often have higher engagement (e.g. 0.9% conversion for 50k-100k Instagram followers). In India, evidence (shared by Cuelinks network/platform) suggests top publishers earn comfortable incomes (5-6 figures), while amateurs earn under $10K/year, mirroring global splits.
Channel Mix Comparison (India vs Global)
| Partner Type | India (Trend/Insight) | Global (2025) | Year |
| Loyalty/Cashback (Rebates) | Widely used (Paytm, Zingoy, etc.); high user adoption | 33% of affiliate spend; 50% of transactions | 2025 |
| Content (Blogs/Media) | Hundreds of sites (news, reviews, influencers) | 44% of spend; 27% of transactions | 2025 |
| Influencers/Creators | Rapidly growing (YouTube, Instagram stars) | 4% of spend; 6% of transactions | 2025 |
| Voucher/Coupon Sites | Exploded 17% in 2024 (DesiDime-like) | 6% of spend; 9% of transactions | 2024- 25 |
Table 2: Affiliate partner types, qualitative & quantitative India context vs. global share of spend/transactions.
Global Affiliate Marketing Statistics
Market Size & Growth (2021-2026)
Worldwide, affiliate marketing is a multi-billion-dollar industry. Cognitive MR pegged the global affiliate market at $18.5B in 2024. VerifiedMarketReports estimated ~$12B in 2020 growing to ~$24B by 2025 (≈10% CAGR). Other analyses range from $13B (in 2022) to $17B by 2025.
Regionally, North America holds ~40% of global affiliate revenue, with Europe at ~30% and Asia-Pacific (~23%) growing fastest.
Affiliate budgets are rising: brand spending was up ~1% and commissions up 1% in 2025 vs 2024, and ~40% of companies plan to boost affiliate budgets in 2026.
Over the next 3 years, forecasts anticipate steady double-digit growth: global affiliate marketing is on track to exceed $19-24B by 2026, and even reach $30B+ by the early 2030s.
Channels & Conversions
Globally, affiliate marketing continues to outperform other channels in ROI. Average affiliate programs generate $12 revenue per $1 commission. Virtually all (81% of brands; 84% of publishers) now use affiliate marketing.
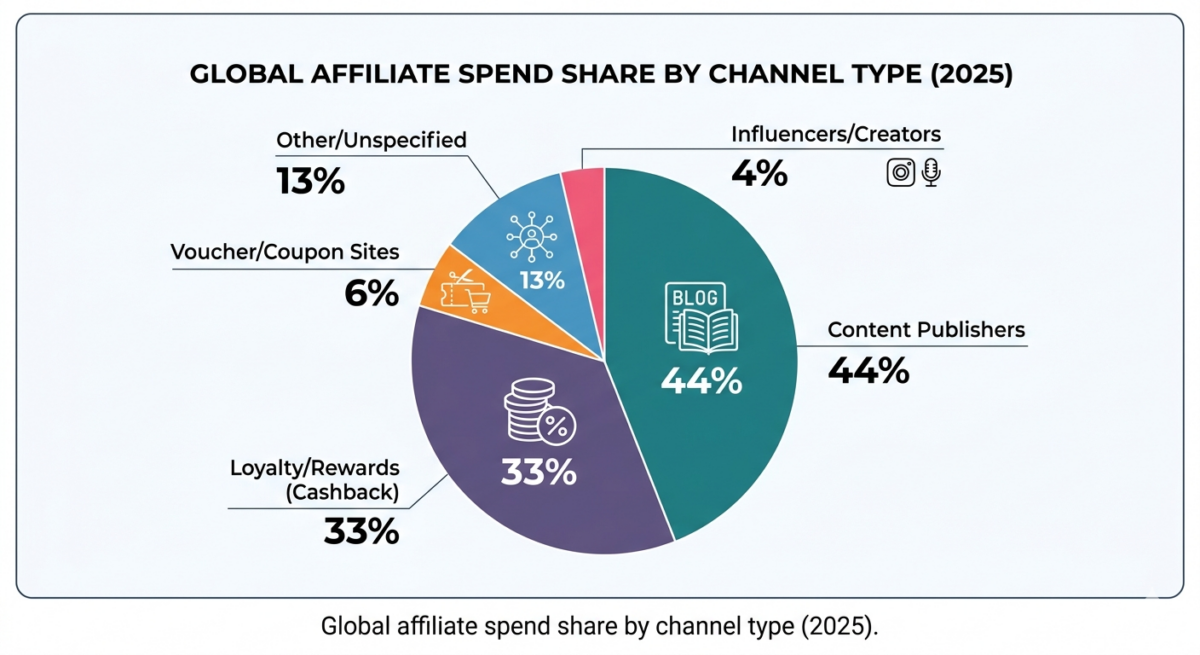
Channel breakdowns show coupon/cashback and loyalty affiliates are most efficient: for example, loyalty/rewards affiliates delivered 50% of transactions with only 33% of spend. Content partners consume 44% of spend to produce 27% of transactions.
Overall, affiliate-referred orders are substantial, one study (by NEWMEDIA.COM) found 16% of all online orders come from affiliates, roughly the same as email marketing share. Commission payouts to publishers exceeded $10 billion globally in 2024, underscoring scale.
In practice, leading affiliate channels are SEO-driven content (78% of affiliates rely on organic search), email (used by 23%), and social media (used by ~40% of affiliates). Mobile is significant: as of mid-2024 about 41% of affiliate revenue came from mobile, reflecting mobile’s rising share.
Top Verticals
The highest affiliate adoption is in retail/fashion, followed by travel and finance. For example, nearly 80% of travel brands have affiliate programs, generating ~20% of online travel bookings. In retail/fashion, affiliates often drive over 25% of online sales.
Other notable niches: health/wellness (68% of brands use affiliates) and beauty/cosmetics (affiliates now drive ~18% of sales).
Regionally, Asia-Pacific’s fastest-growing economies (India, SEA) are pushing affiliate spend up by 10% CAGR, while Europe remains stable (€19B in affiliate revenue 2024).
Mobile & Device Trends
On a global level, mobile devices account for about 55-57% of affiliate-driven purchases. Smartphone traffic is now the norm; nearly half of affiliates report mobile as their top channel. Consequently, global affiliate networks report ~50% of clicks and sales on mobile.
Desktop still has an edge in conversion value for some segments, but the gap is closing. Notably, in 2024 the US affiliate channel saw a slight dip in sales as mobile underperformed, but overall mobile conversion rates are trending up.
Publisher & Influencer Stats (earnings)
Affiliates worldwide remain mostly small-scale. For instance, 77% of affiliates are sole proprietors, and ~58% earn under $10K/year (only 11.7% make over $100K). Yet the profession can be lucrative: in emerging niches (e.g. e-learning, SaaS) average affiliates can earn $8-10K/month.
Influencers are increasingly joining: 42% of social influencers now use affiliate links and influencer-driven campaigns grew ~26% YoY. Influencers generally see higher conversion (e.g. ~4.5% for link clicks) due to strong trust.
Affiliate-driven content (blogs, video) tends to outperform generic ads. For example, content affiliates (e.g. product review bloggers) often convert 3-5%, compared to <1% for banner ads. These dynamics make affiliate marketing an increasingly central revenue stream for both publishers and brands.
Channel Mix Comparison (Global)
| Partner Type | Global (2025) | Description |
| Loyalty/Rewards (cashback) | 33% of spend; 50% of transactions | Cashback and loyalty programs yield half of all affiliate sales for one-third of spend. |
| Content Publishers | 44% of spend; 27% of transactions | Blogs, review sites (news/media) generate 27% of orders. |
| Influencers/Creators | 4% of spend; 6% of transactions | Social media and influencer affiliates drive a growing, albeit still small, portion of sales. |
| Voucher/Coupon Sites | 6% of spend; 9% of transactions | Dedicated coupon/promo code sites contribute a modest share of spend. |
Table 3: Global affiliate partner channel mix (2025), share of affiliate spend and resulting transactions.
Timeline of Affiliate Marketing Milestones
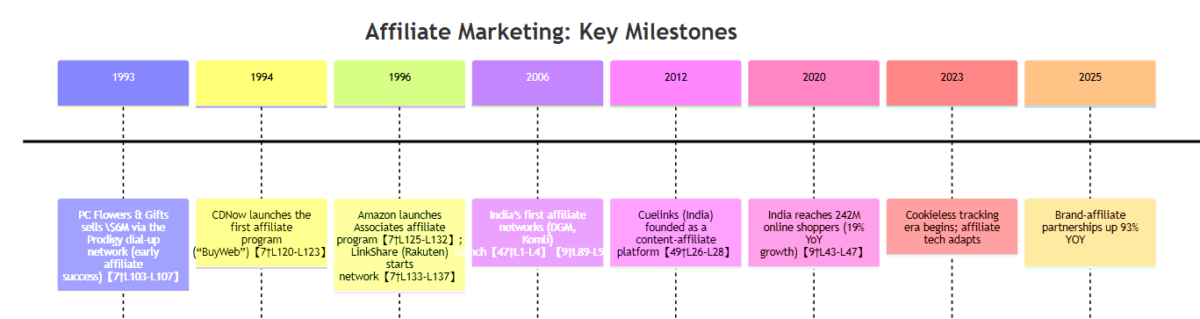
Figure 1: Major milestones in affiliate marketing history.
Conclusion & Actionable Takeaways
Affiliate marketing is solidly mainstream by 2027.
- Publishers and advertisers should treat it as a core channel: invest in high-performing affiliate partners (loyalty/cashback and content sites account for ~77% of affiliate sales) and optimize for mobile (India: >60% mobile purchases).
- Publishers should diversify: ~65% rely on blogs and ~42% of influencers use affiliate links, so blend content, coupons, and social.
- Use data to allocate spend: content affiliates deliver 27% of transactions on 44% of spend, ensure you measure multi-click attribution beyond last-click.
- For advertisers: bolster coupons/cashback strategies (37% of global affiliates say budget increased in these areas) and nurture emerging affiliate niches (e.g. fintech referral, BNPL affiliate is growing).
- Most importantly, keep analytics front-and-center: ~59% of brands struggle with cross-channel attribution, so use deep-tracking to capture affiliate value.
In summary, armed with these statistics and forecasts, affiliate marketers can set benchmarks and strategy for 2026. By leveraging the insights above, both affiliates and advertisers can maximize revenue, optimize spend, and stay ahead in this data-driven channel.
Data gaps/notes: India-specific affiliate conversion rates and many vertical splits are not public; we rely on overall e-comm trends as proxies.
Sources: Cognitive Market Research (APAC affiliate report); Verified Market Reports; NewMedia stats; Forbes India e-commerce; Cuelinks Blog. All stats above are accompanied by citations (Year of publication noted where available).

Sahil Ajmera is content writer with more than 7 years of work experience in field of Affiliate Marketing, Digital Marketing, etc. He loves saving money on everything. His aim is to get readers exactly what they are looking for and that too without wasting much of their time. Whatever he is writing on, you are sure to find a way to earn & save good!